smouksassi.github.io
Samer Mouksassi
Bio & Contact
Samer Mouksassi Blog Posts
Categories
All
(17)
3D
(2)
animation
(1)
covariates
(1)
distributions
(1)
Drug Development Tool
(2)
Drug Repurposing
(1)
FDA Approvals
(1)
Forest Plots
(1)
Interactive App
(2)
maps
(1)
Methods
(1)
news
(4)
pediatrics
(2)
simulation
(1)
stats
(1)
TB
(2)
uncertainty
(1)
visualization
(15)
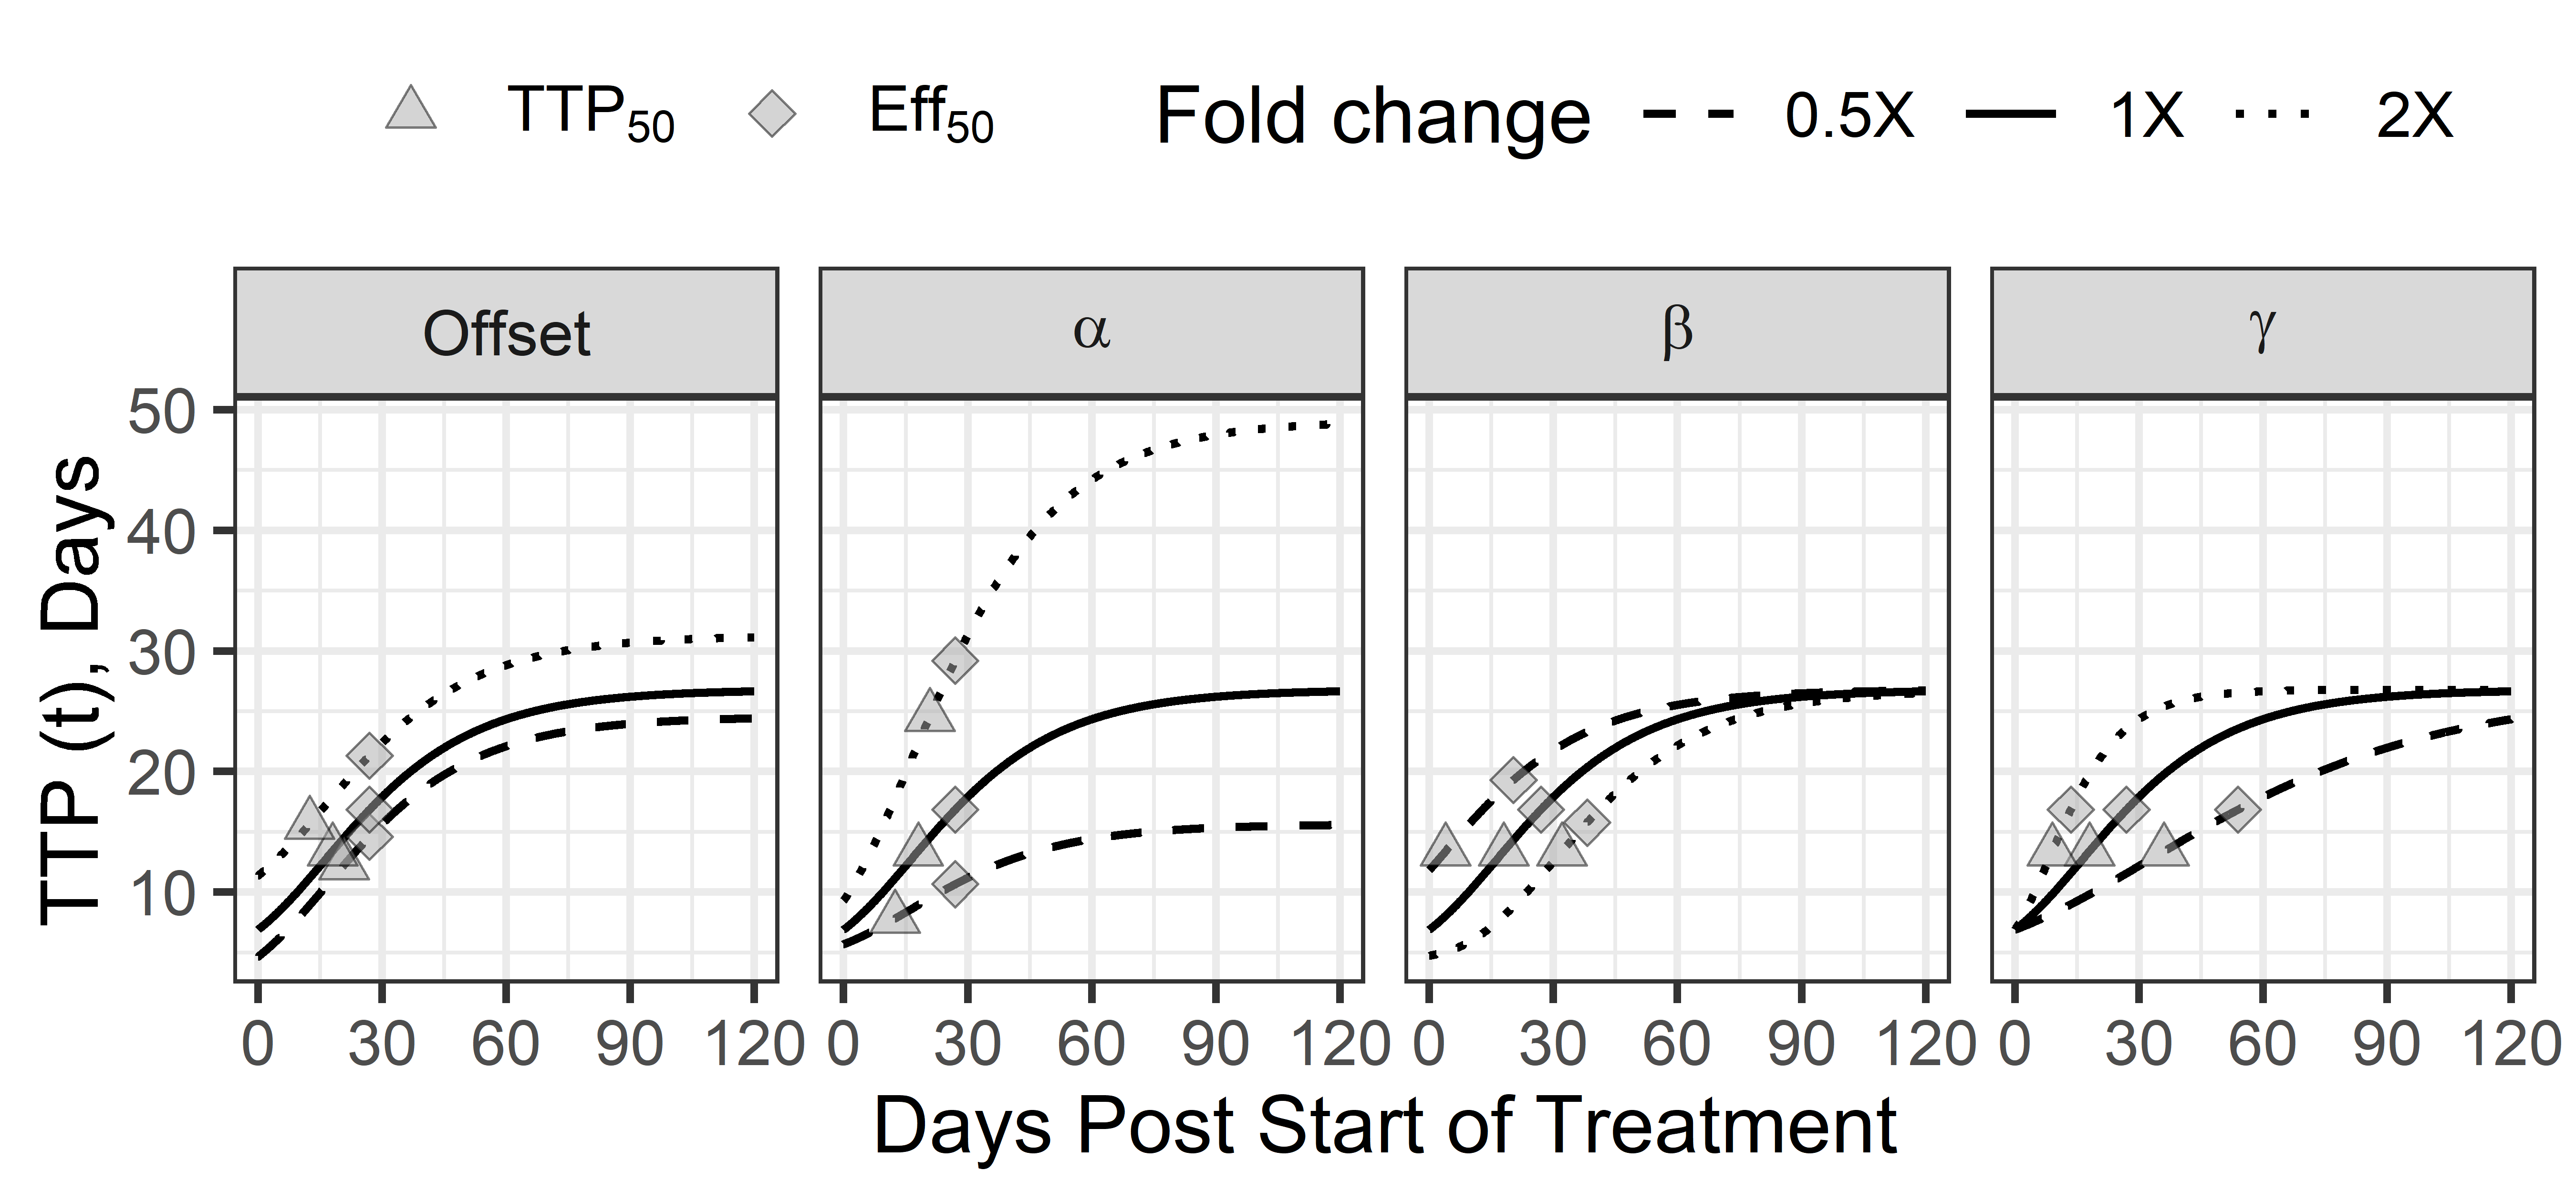
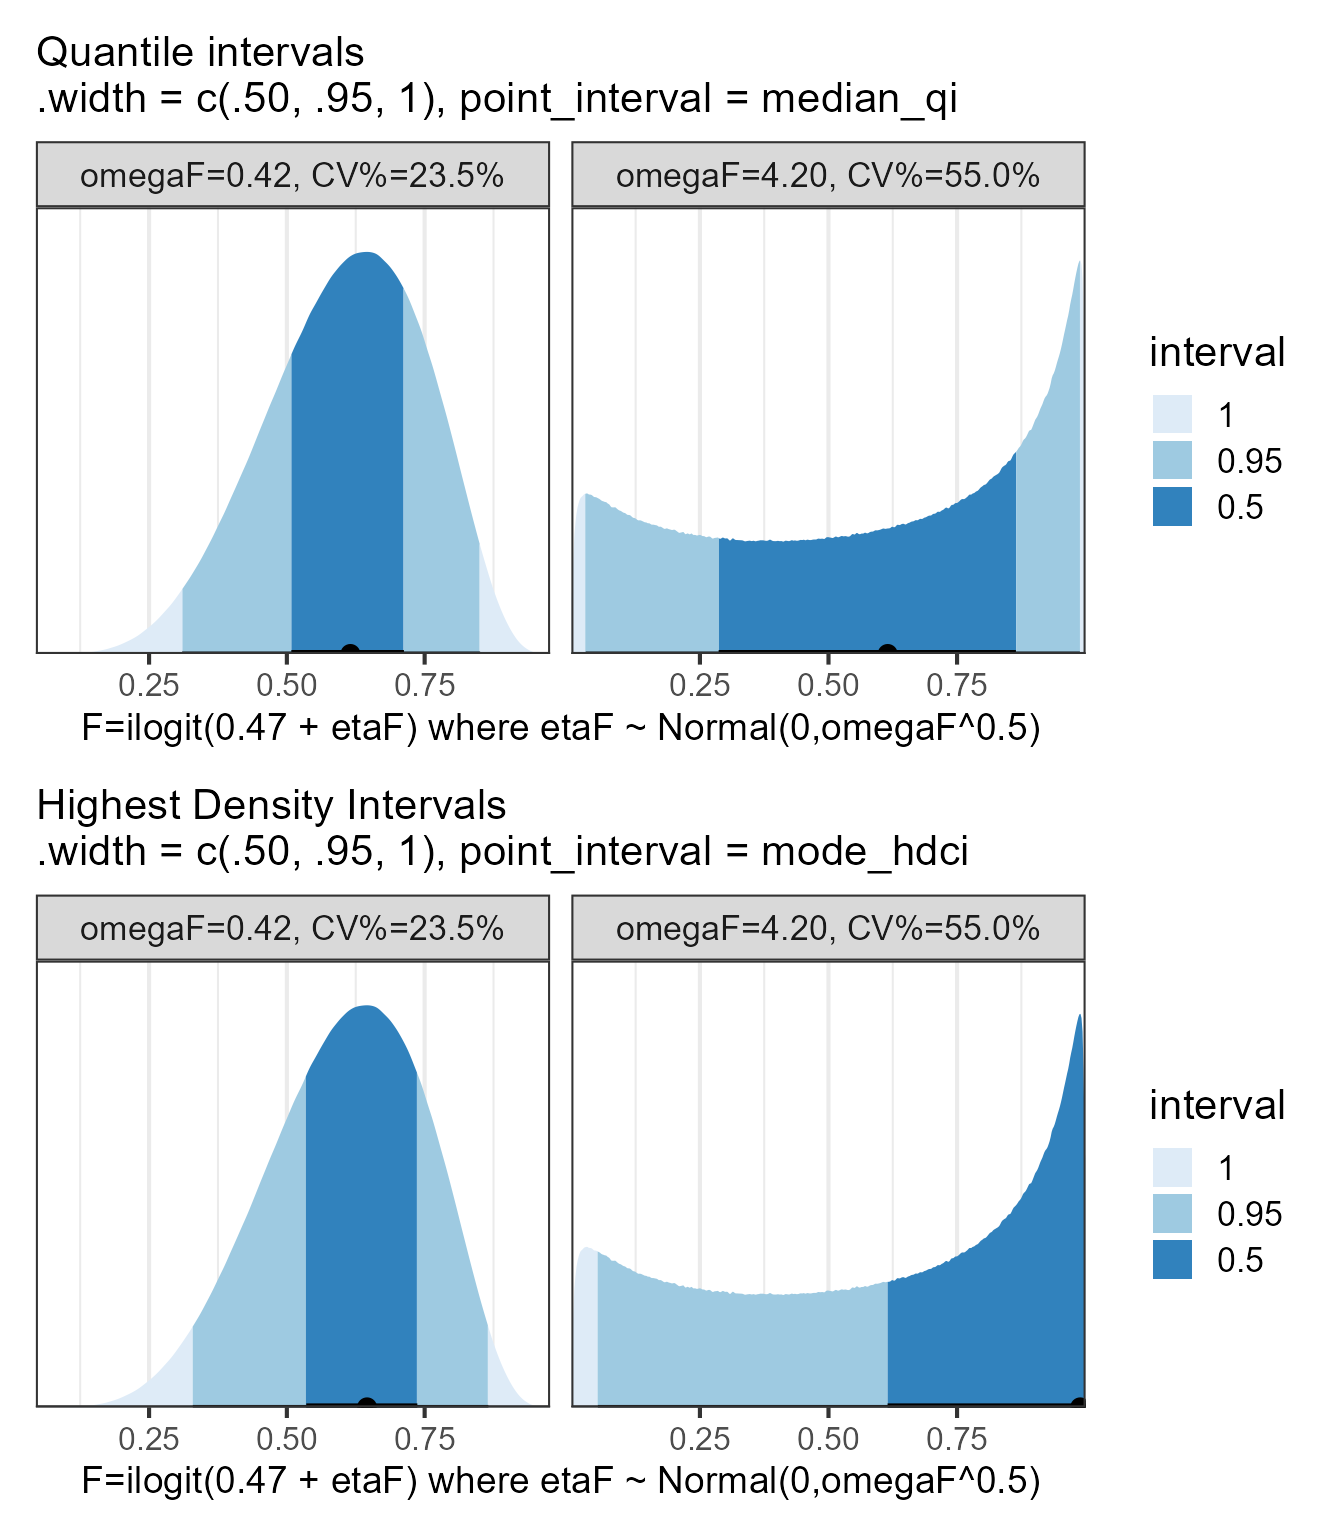
Time to Positivity (TTP) in Tuberculosis Trials: Part 2
TB
Interactive App
visualization
Drug Development Tool
This is part 2 of last week blog post Time to Positivity (TTP) in Tuberculosis Trials: Part 1
Jan 21, 2026
Samer Mouksassi
Time to Positivity (TTP) in Tuberculosis Trials: Part 1
TB
Interactive App
visualization
Drug Development Tool
A while back, I did a consulting project for the critical path institute (CPATH) that led to the creation of a shiny app to explore Time to Positivity (TTP) in Tuberculosis…
Jan 14, 2026
Samer Mouksassi
Maps, Projections and a Globe
3D
visualization
maps
During my journey in pharmacometrics, model-informed drug development and applied data sciences in R, it was rare when I had to produce figures with maps. Yet I love maps…
Dec 13, 2025
Samer Mouksassi
Applications of the Delta Method in Pharmacometrics
Methods
visualization
uncertainty
In pharmacometrics models we often have model parameters modeled as a function of one or multiple covariates:
Dec 1, 2025
Samer Mouksassi
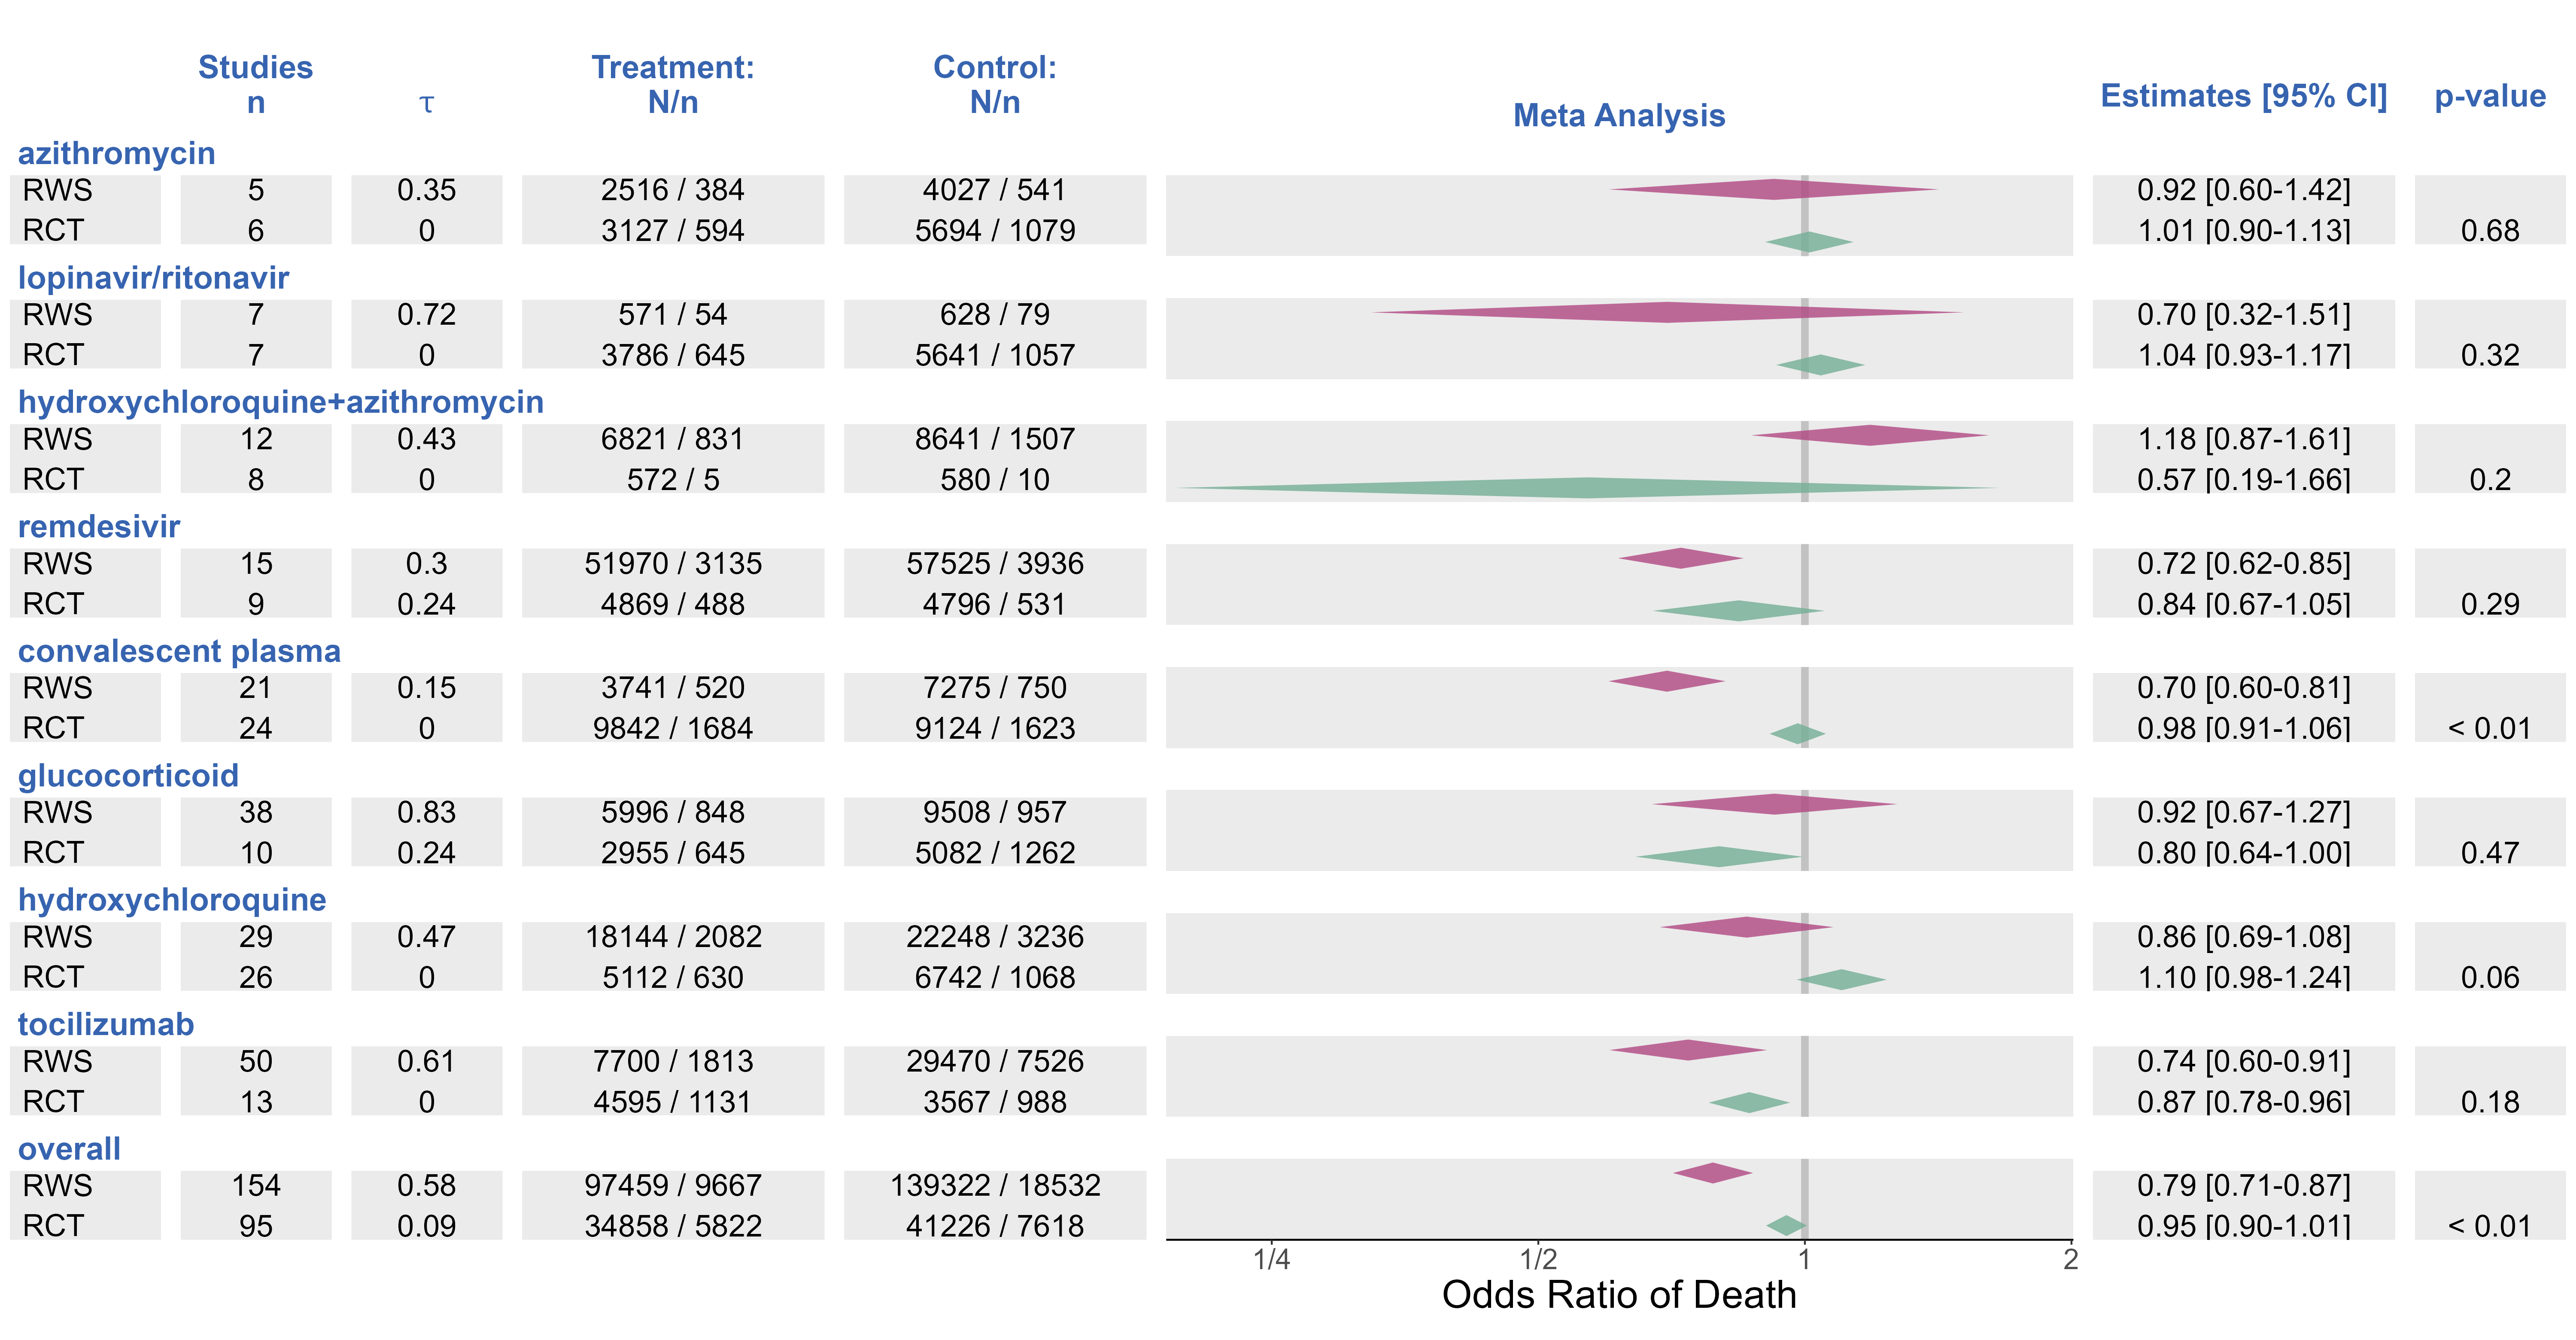
Totality of evidence of Repurposed Therapies
Drug Repurposing
visualization
During the COVID-19 pandemic, both randomized controlled trials (RCTs) and observational “real‐world studies” (RWS) were deployed. RWS mainly used existing…
Nov 24, 2025
Samer Mouksassi
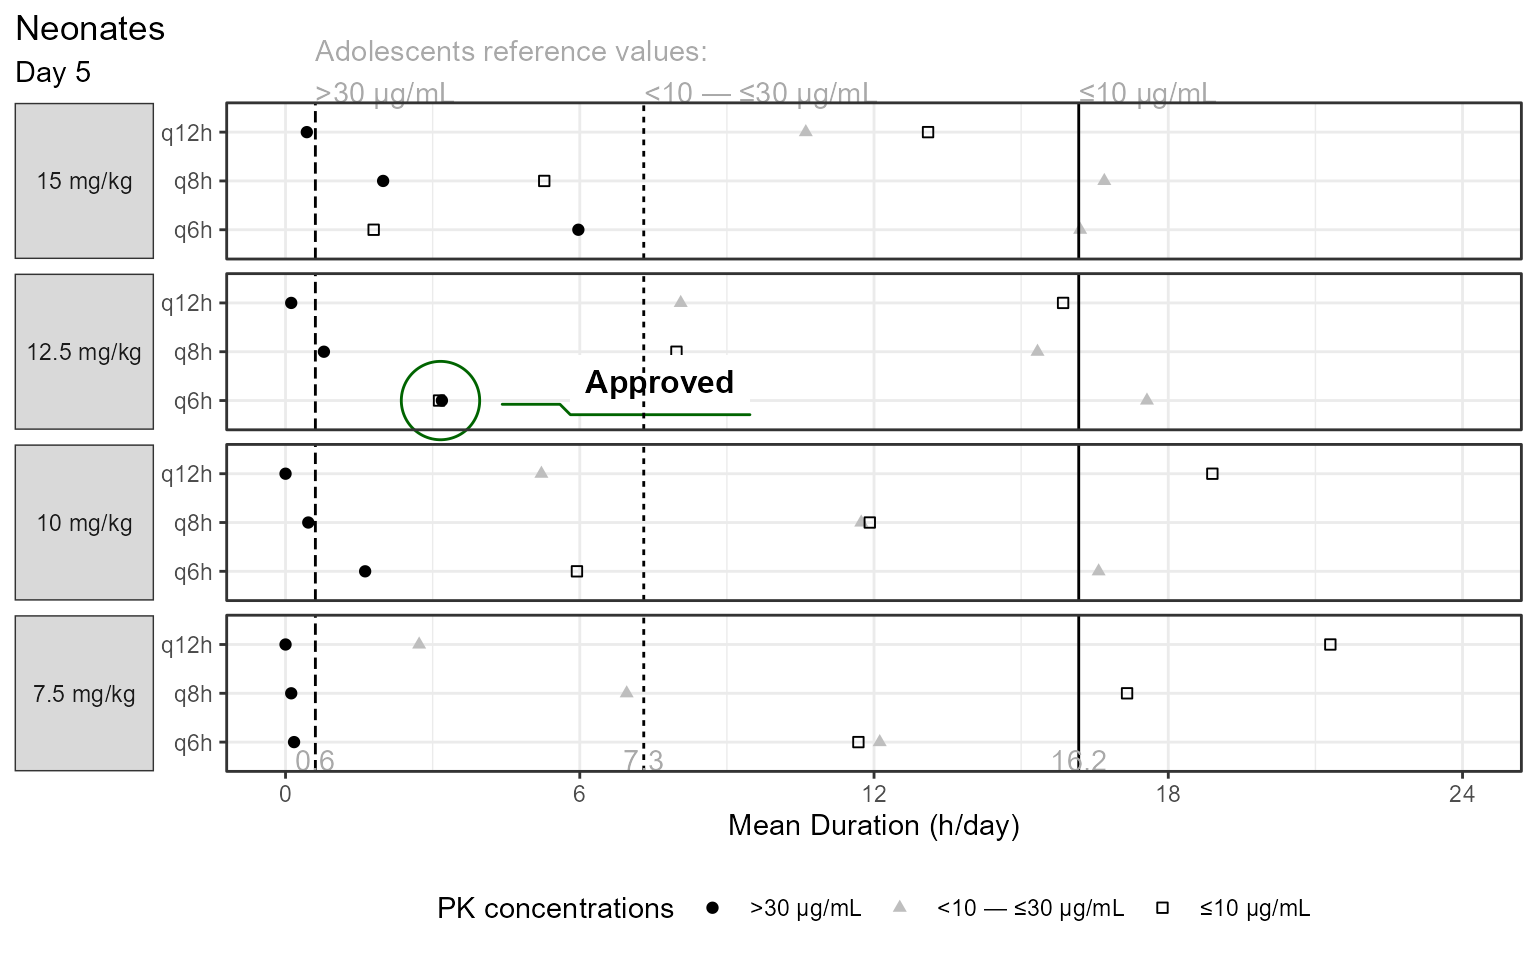
Ofirmev Summary Basis of Approval: Plots
FDA Approvals
visualization
Back in November 2010 the FDA approved Ofirmev (acetaminophen) intravenous injection for use in ages 2 to 16 years for the management of mild to moderate pain and reduction…
Nov 17, 2025
Samer Mouksassi
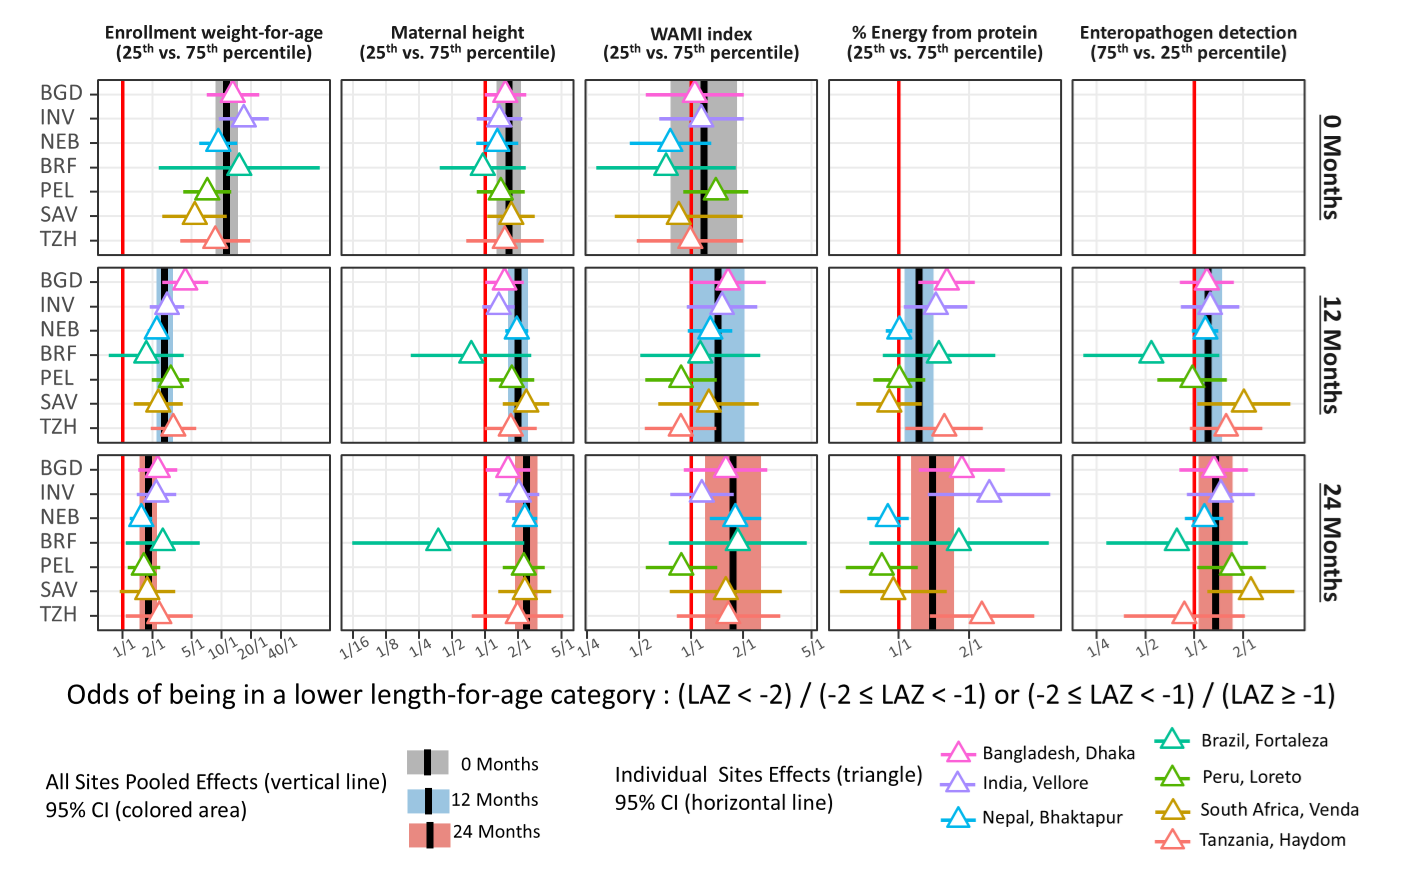
Communicating a Longitudinal Proportional Odds Model with Forest Plots
Forest Plots
visualization
This week, in my post I will revisit one of my 2017 papers entitled Childhood stunting in relation to the pre- and postnatal environment during the first 2 years of life…
Nov 10, 2025
Samer Mouksassi
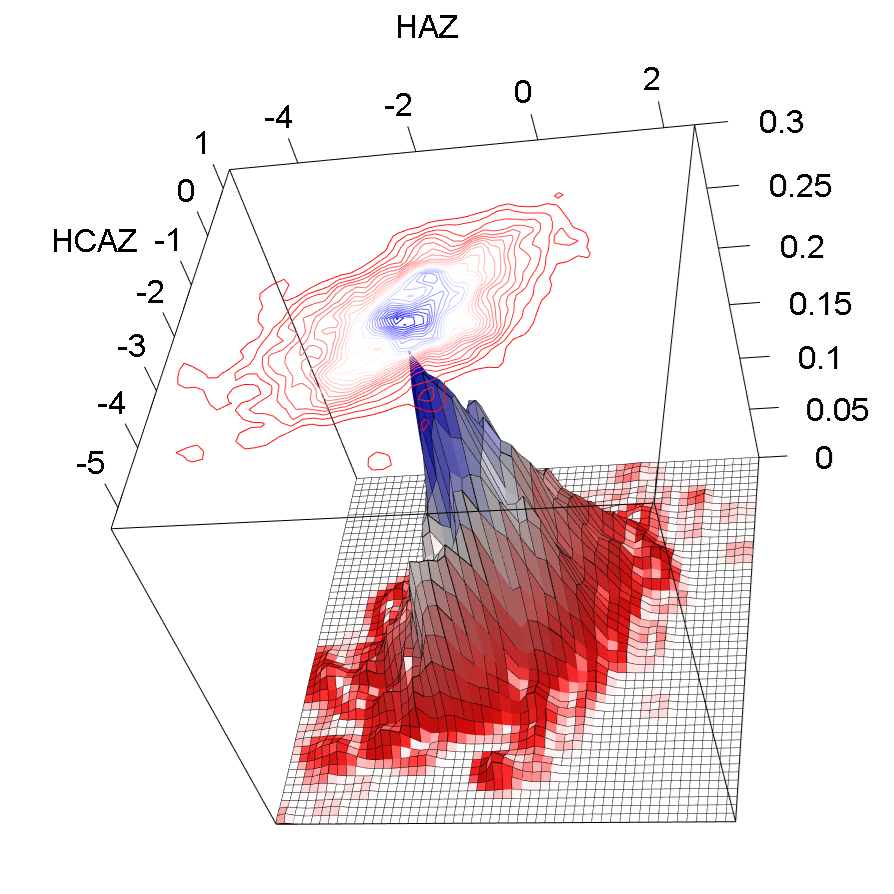
Visualizing 2D Densities with 3D Surfaces and projections
3D
visualization
While at ACOP 2025, one of the posters on Pirana AI automated machine learning had a nice 3D plot showing a representation of the fitness functions based on three…
Oct 31, 2025
Samer Mouksassi
Optimizing Doses to maximize AUC’s utility function
pediatrics
visualization
animation
In this post, I will continue on the theme of last week post by illustrating how can we find the dose that would optimize not only the percentages of patient within the…
Oct 25, 2025
Samer Mouksassi
Comparing Exposures with back to back Density/Boxplots
pediatrics
visualization
In this post, I will cover visualizing simulated drug exposures head to head compare using some
ggplot2
tricks. First we use the NHANES body weight (kg), illustrate the…
Oct 16, 2025
Samer Mouksassi
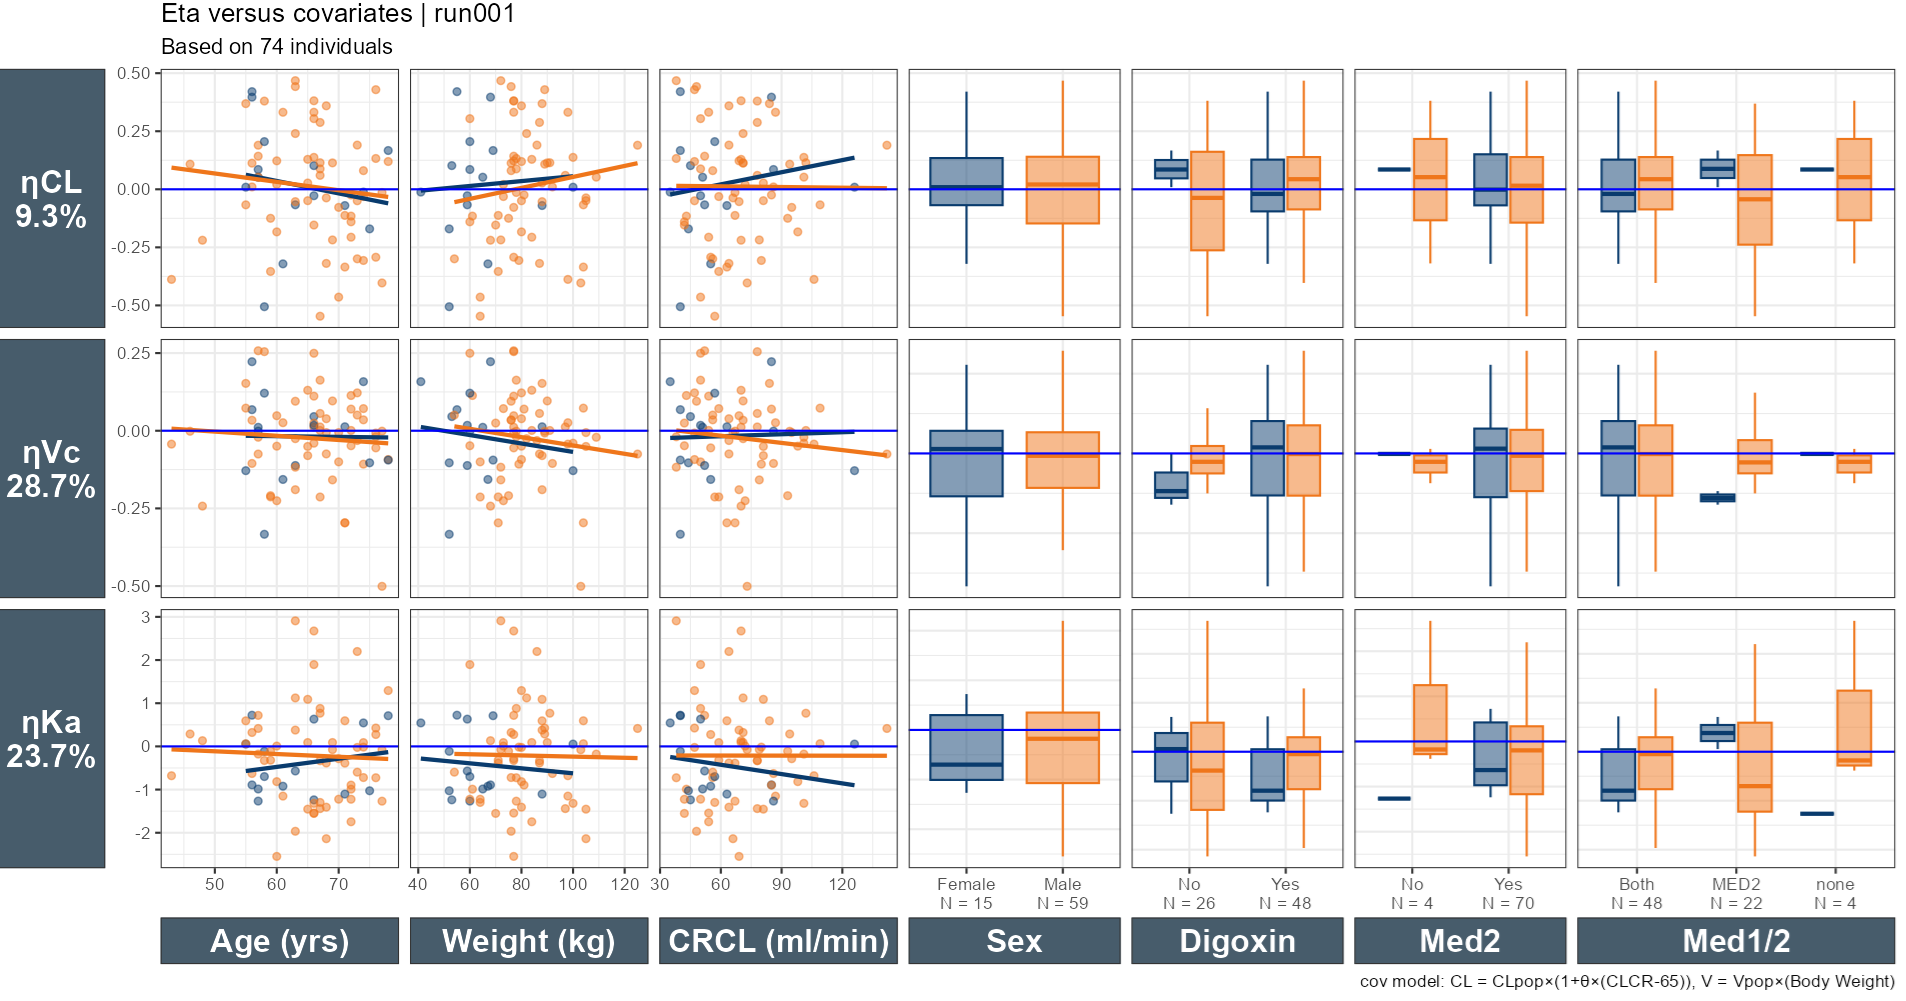
Exploring Covariate Plots
covariates
visualization
In pharmacometrics analyses, it is common to plot the pharmacokinetic model parameters such as Clearance (CL) and Volume of distribution (Vd) versus continuous covariates…
Oct 11, 2025
Samer Mouksassi
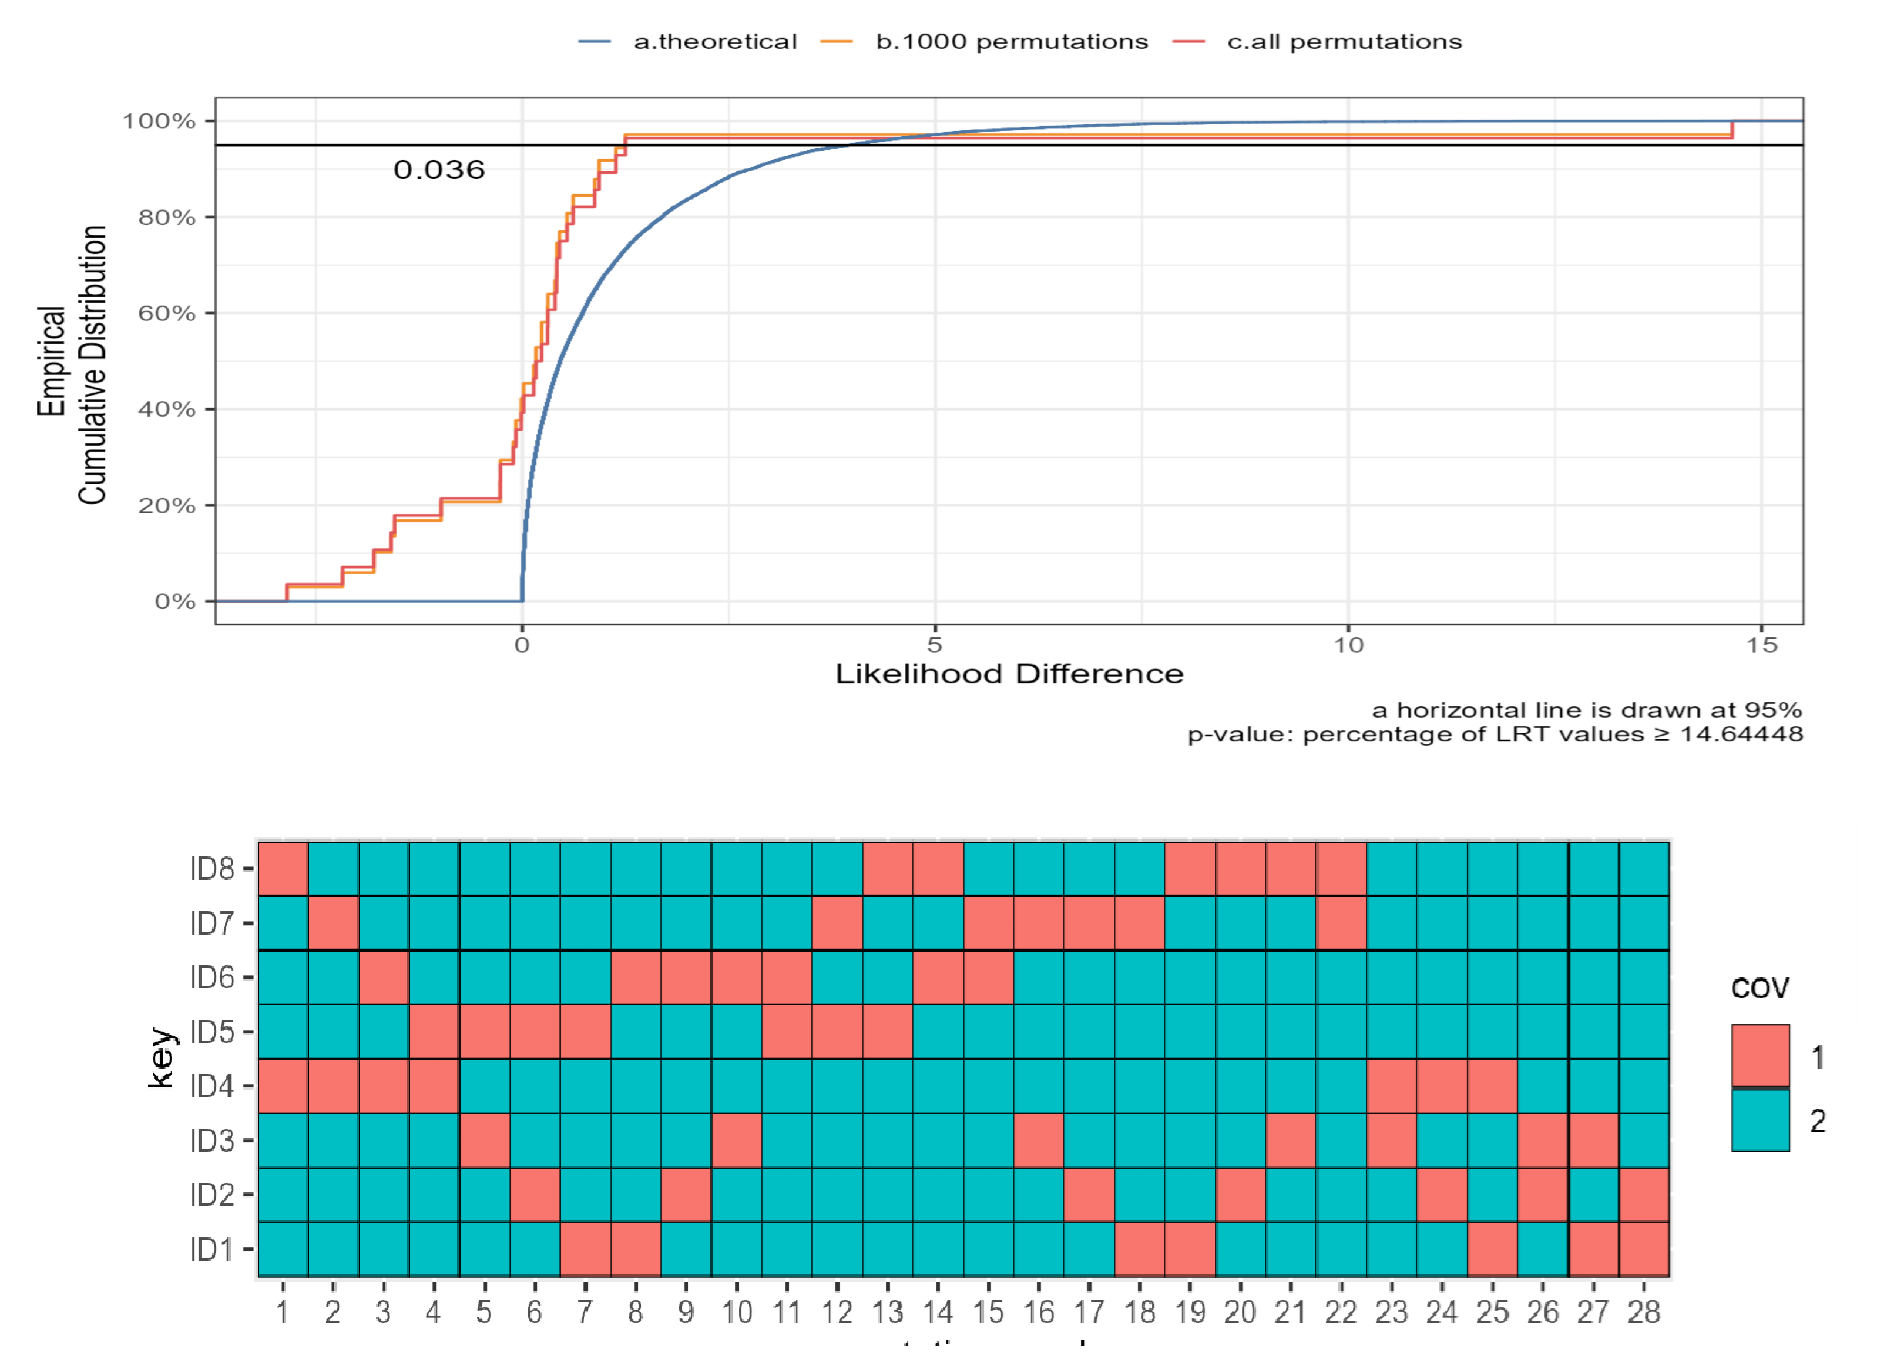
Randomization Tests
stats
simulation
In this post, I will cover a general, randomization-based methodology to compare models without assuming an a priori known distribution for the test statistic. A regular…
Oct 2, 2025
Samer Mouksassi
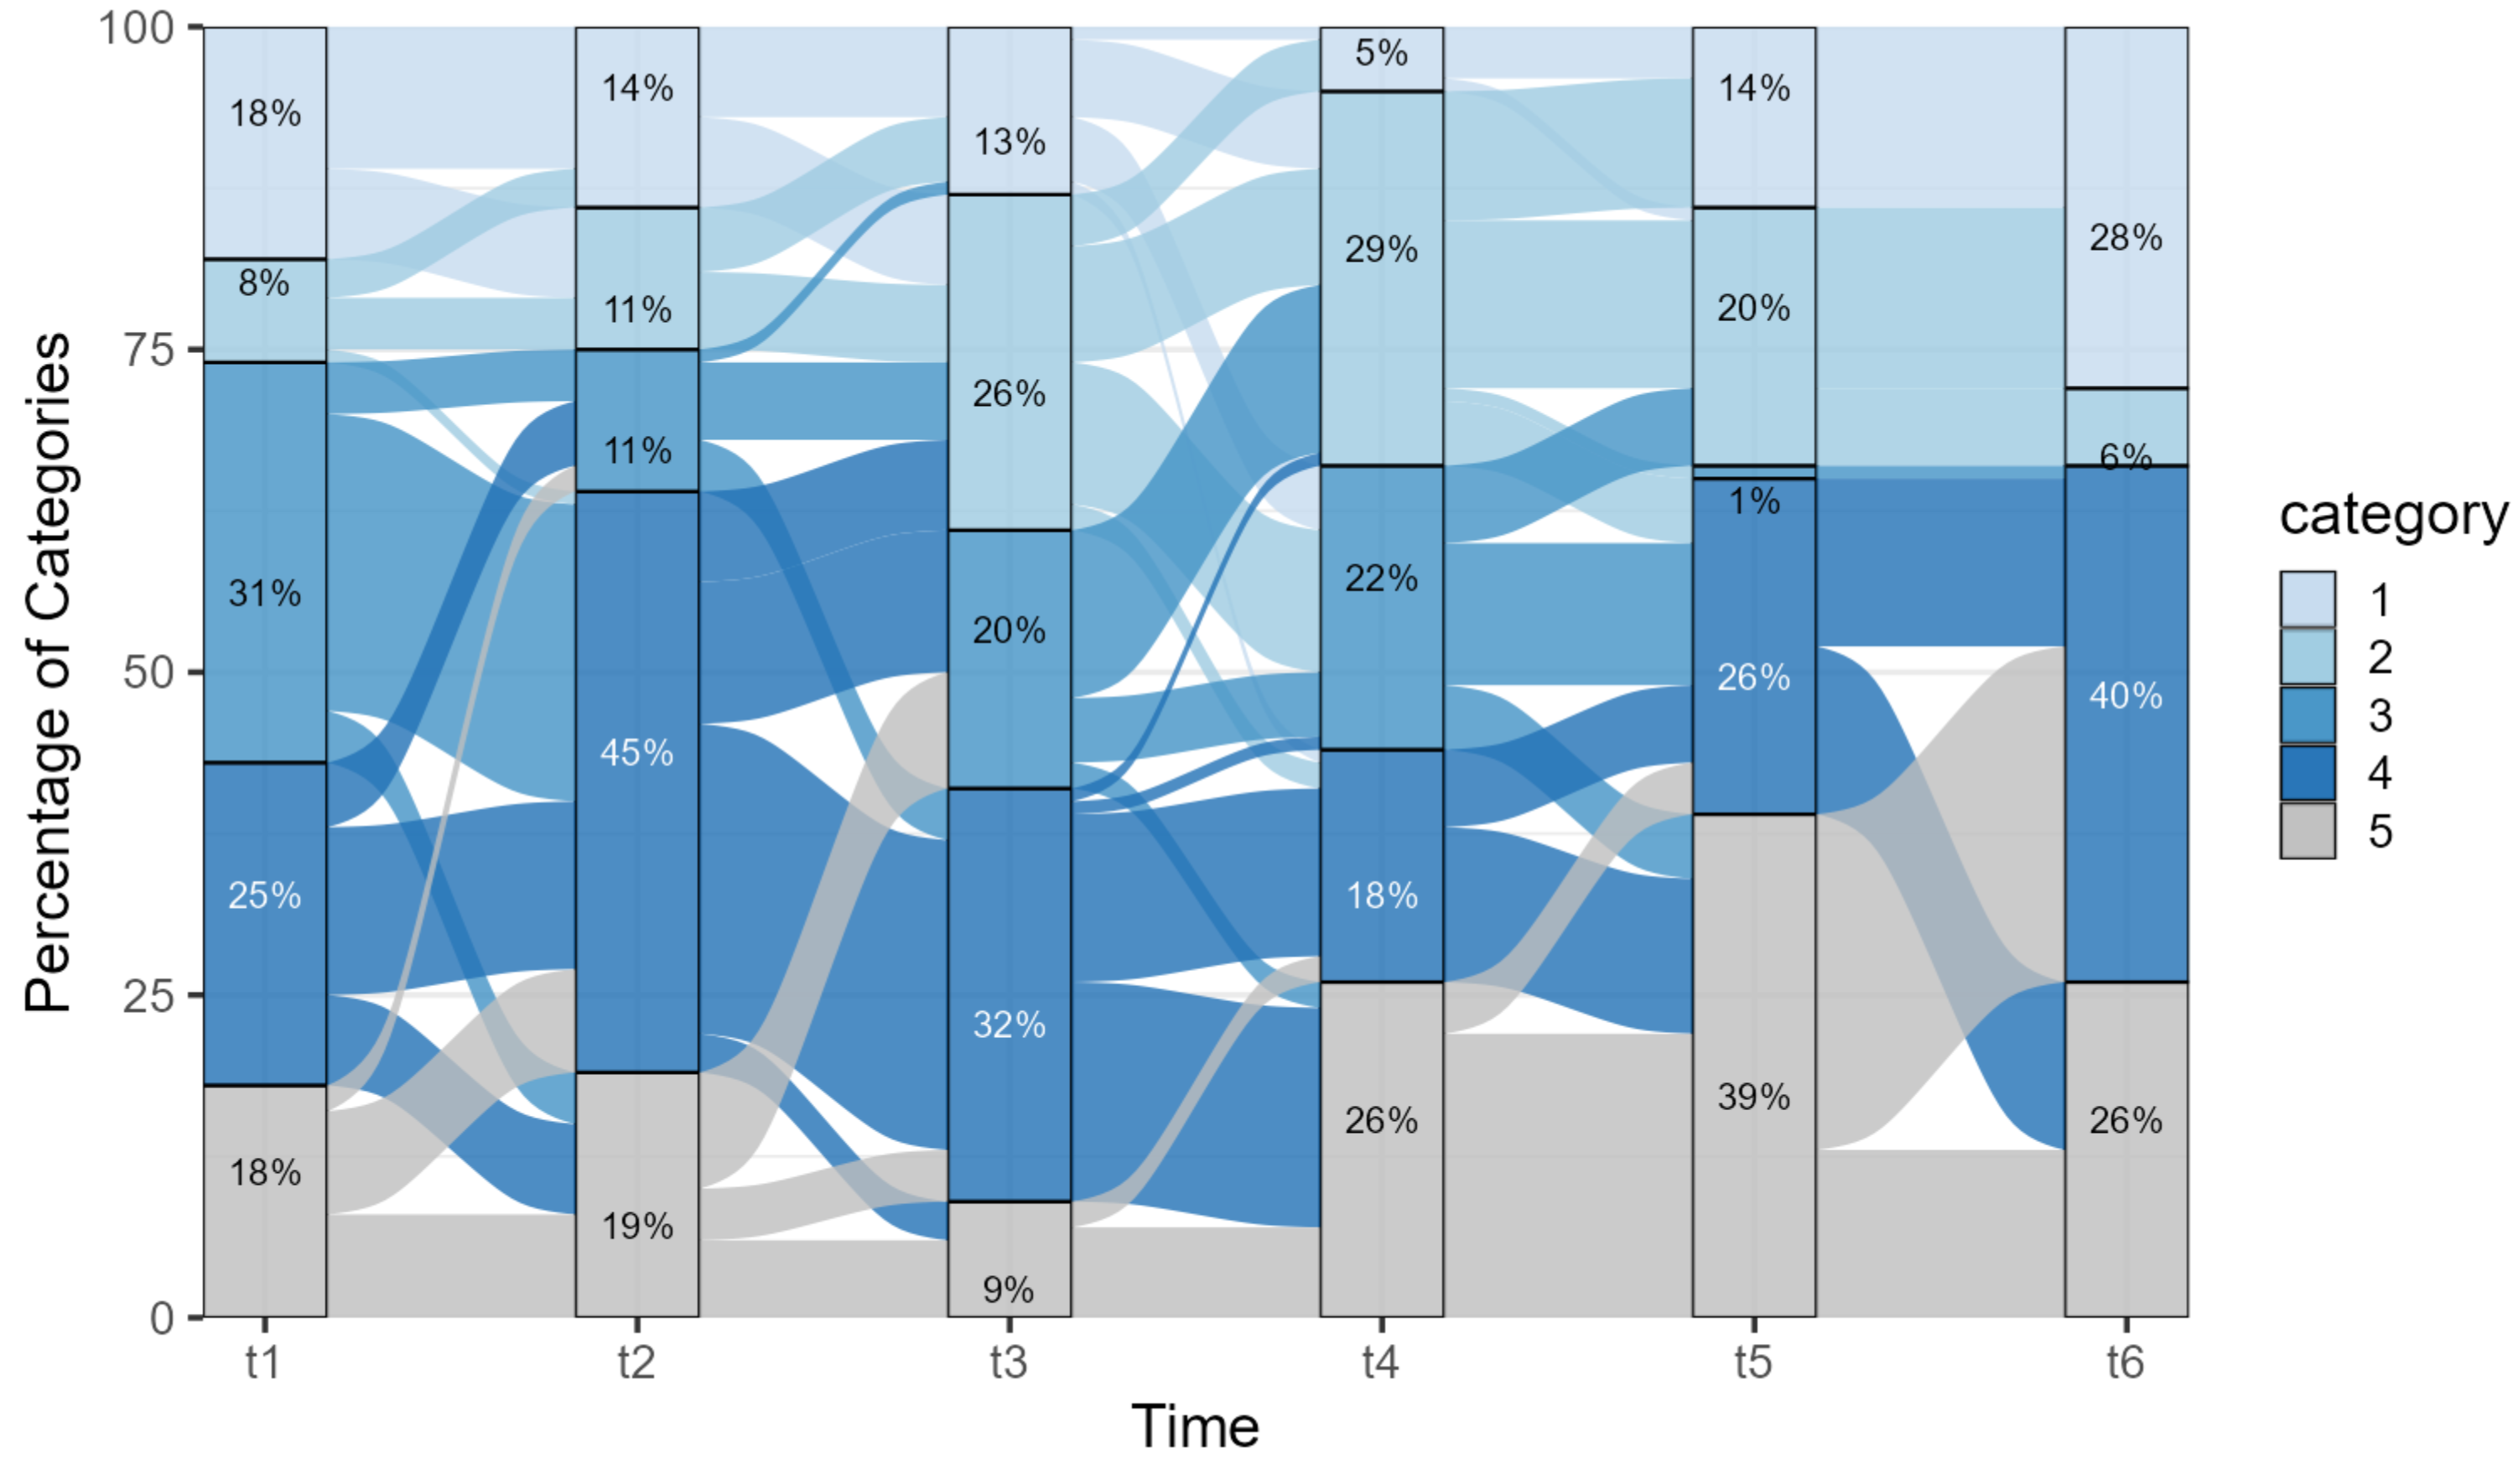
Visualizing Transitions over Time
news
visualization
In this post, I will cover visualizing longitudinal categorical data over time. I will start using a stacked barplot with percentages by category labels.
Sep 19, 2025
Samer Mouksassi
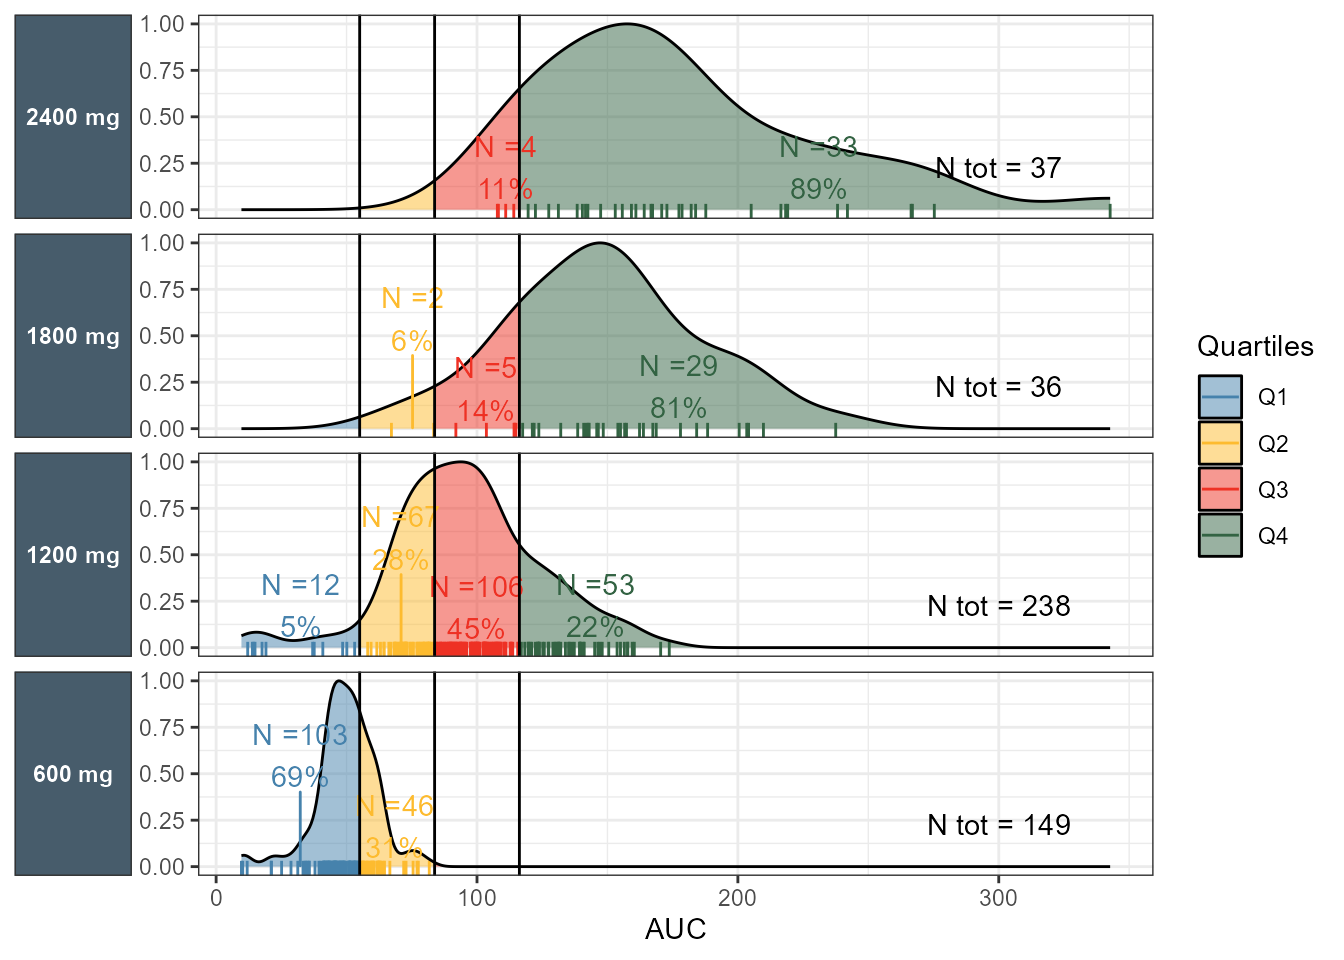
Distributions of Exposures
visualization
distributions
In this post, I will cover visualizing the exposure distributions with more details. The blog post that covered binary response outcomes showed how we often show the…
Sep 1, 2025
Samer Mouksassi
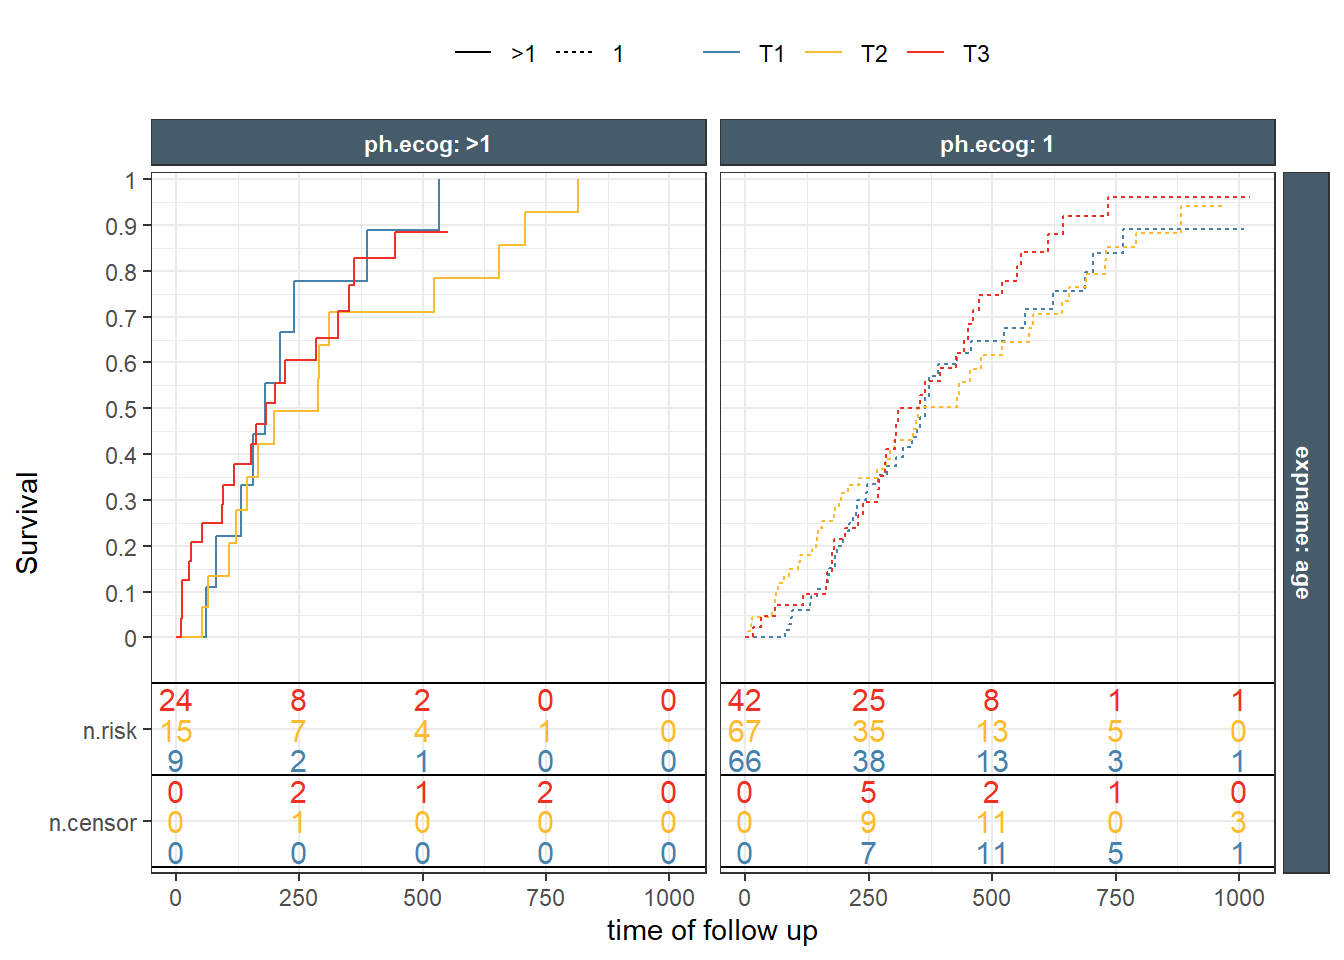
Visualizing Time to Event Response
news
visualization
In this post, I will continue with the exposure response theme. The previous blog post focused on Binary response outcomes. In today’s post I will illustrate how to explore…
Aug 25, 2025
Samer Mouksassi
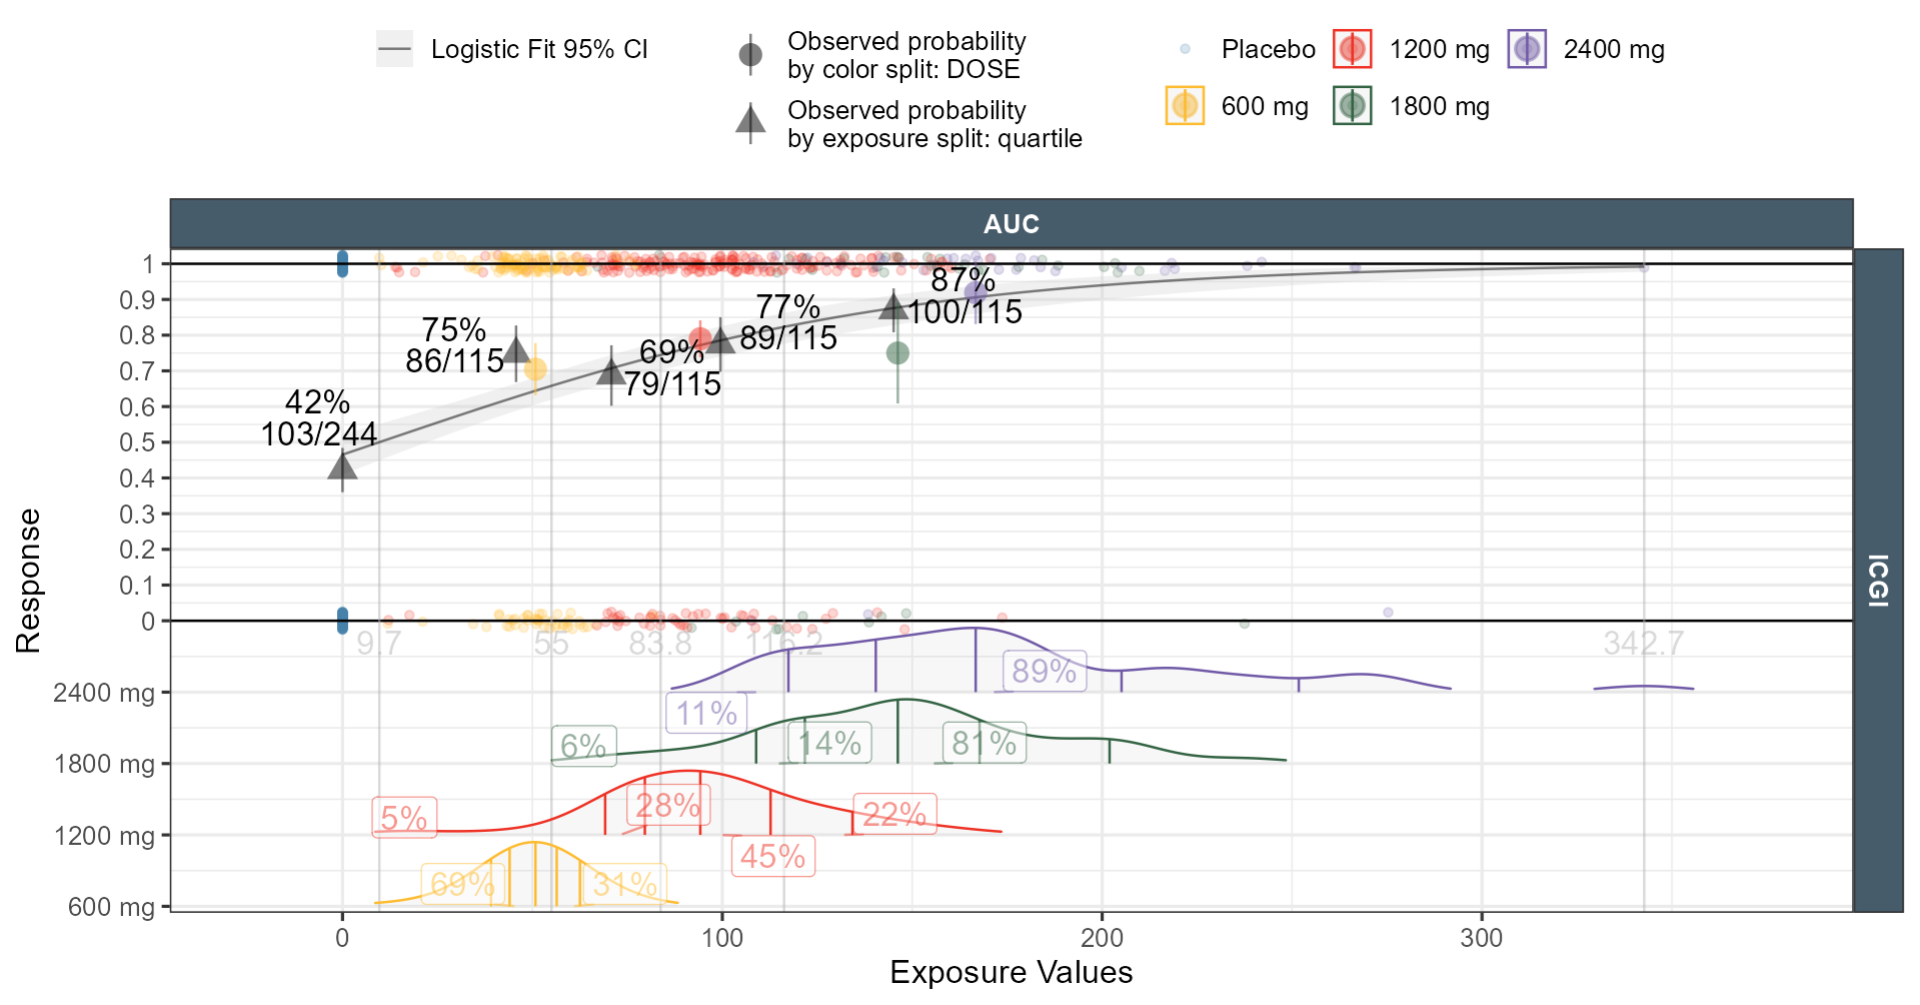
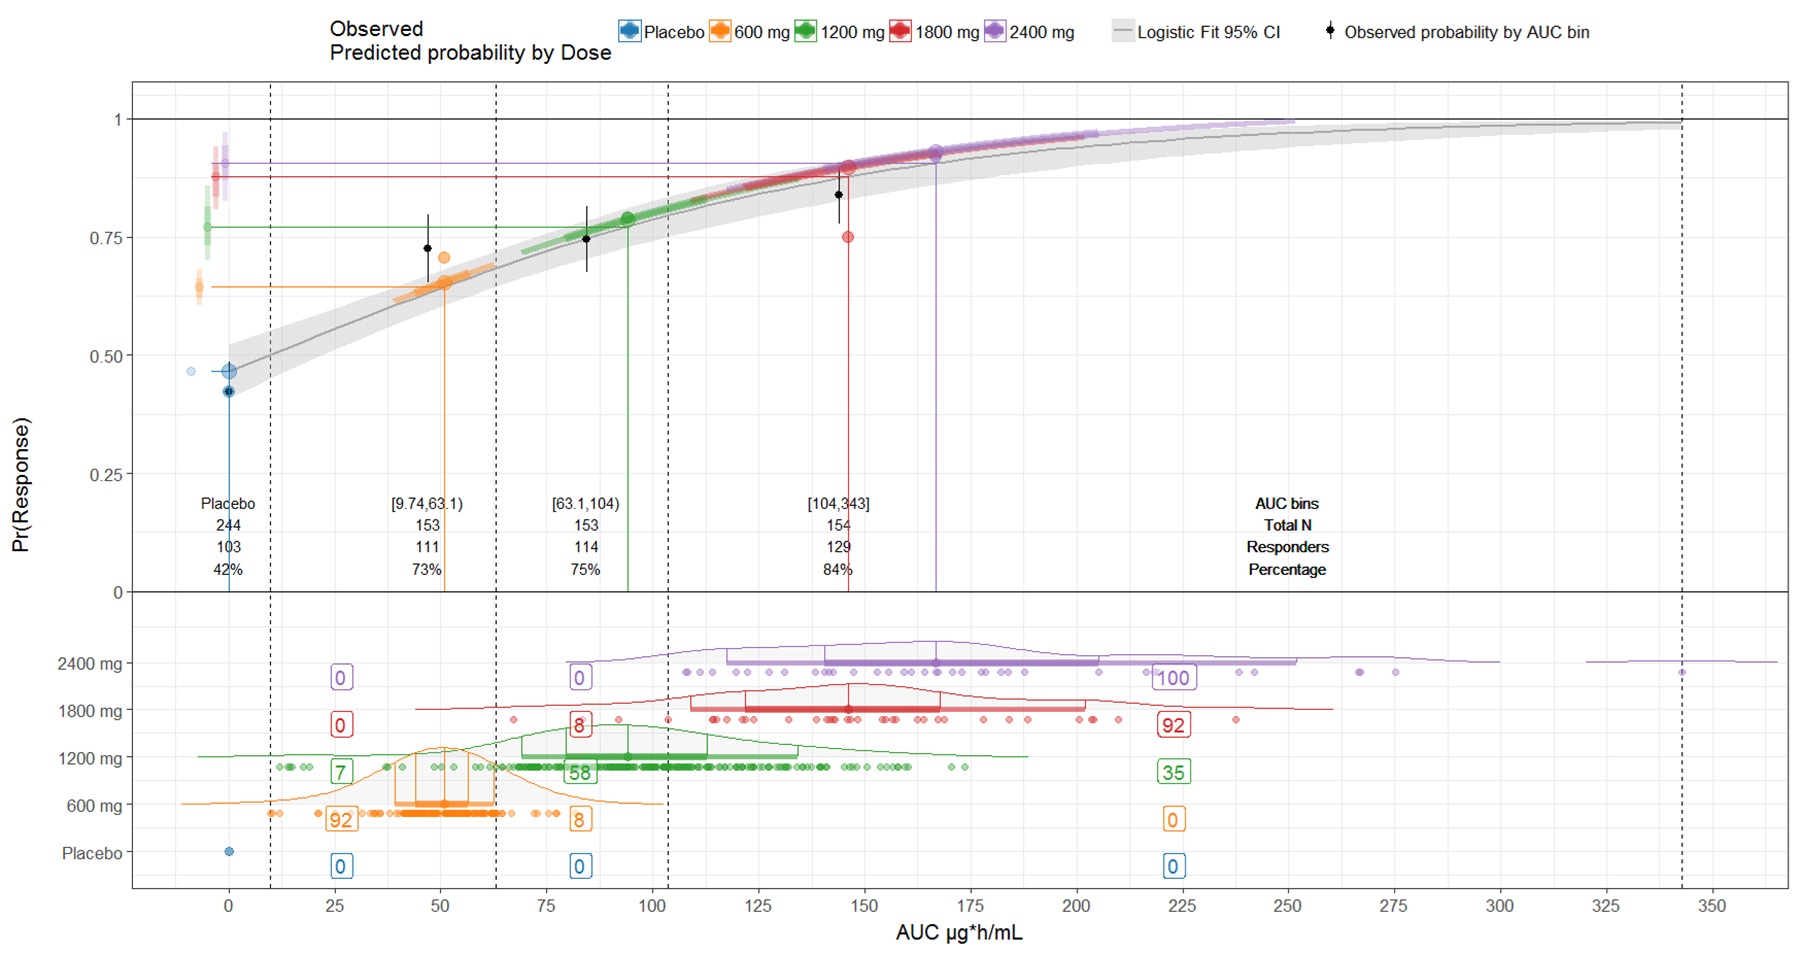
Visualizing Dose Exposure Response
news
visualization
In this post I will provide the code and thinking process behind the figure shared in my first blog post. We will start with a simpler version where we show the Endpoint…
Aug 18, 2025
Samer Mouksassi
Welcome to Samer’s Blog
news
Welcome!
Aug 15, 2025
Samer Mouksassi
No matching items