custom_colorscale <- list(
list(0.0, "transparent"),
list(0.001, "rgb(255,255,255)"),
list(1.0, "rgb(0,0,139)")
)
p <- plot_ly(x = est$x1, y = est$x2, z = est$fhat/max(est$fhat)) %>%
add_surface(
opacity = 0.3, # Make the surface semi-transparent
colors = ramp.col(c("red","white", "blue")),
#colorscale = custom_colorscale,
contours = list(
z = list(
show = TRUE,
usecolormap = TRUE,
highlight = TRUE,
highlightcolor ="black",
start = 0.01,end = 1, size = 0.02 ,
project = list(z = TRUE),
line = list( width = 0,color = "black")
),
x = list(show = TRUE,highlight = FALSE),
y = list(show = TRUE, highlight = FALSE)
)
) %>%
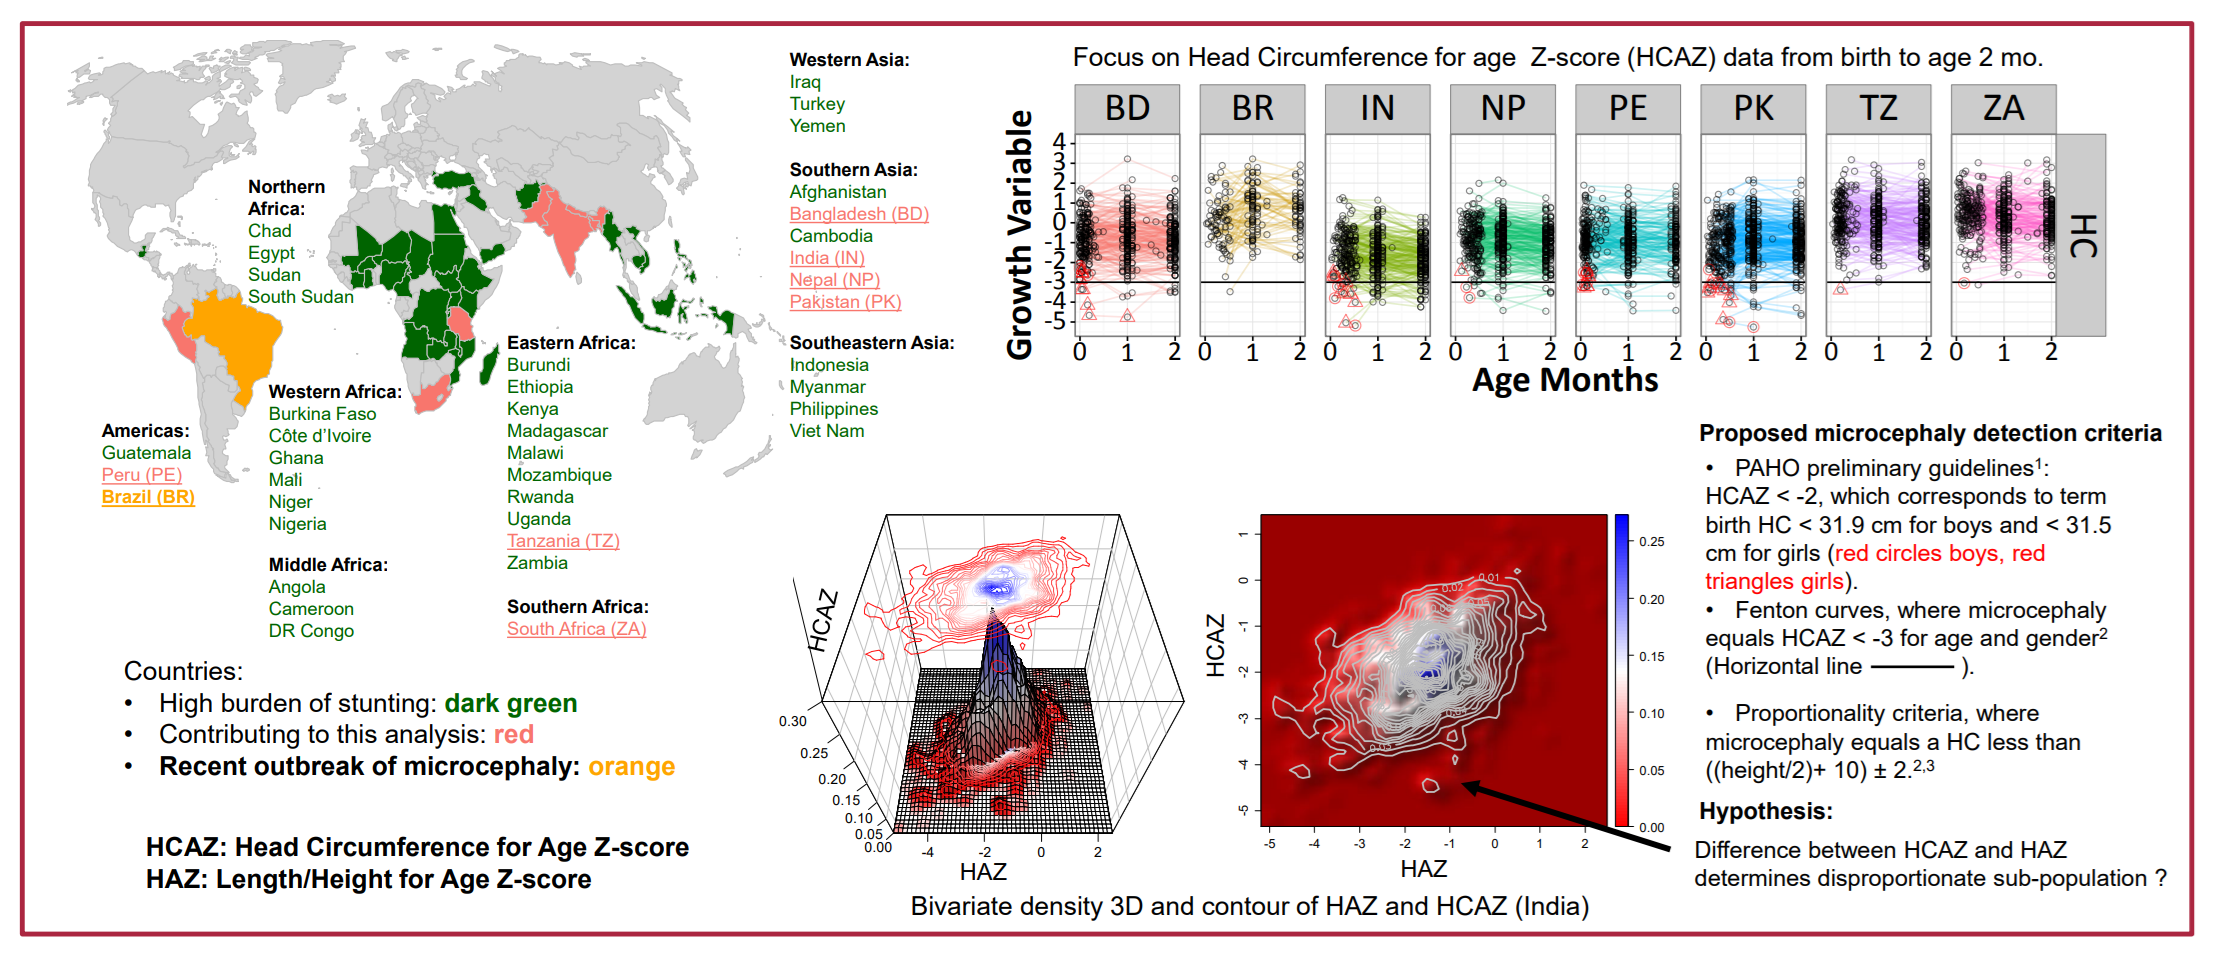
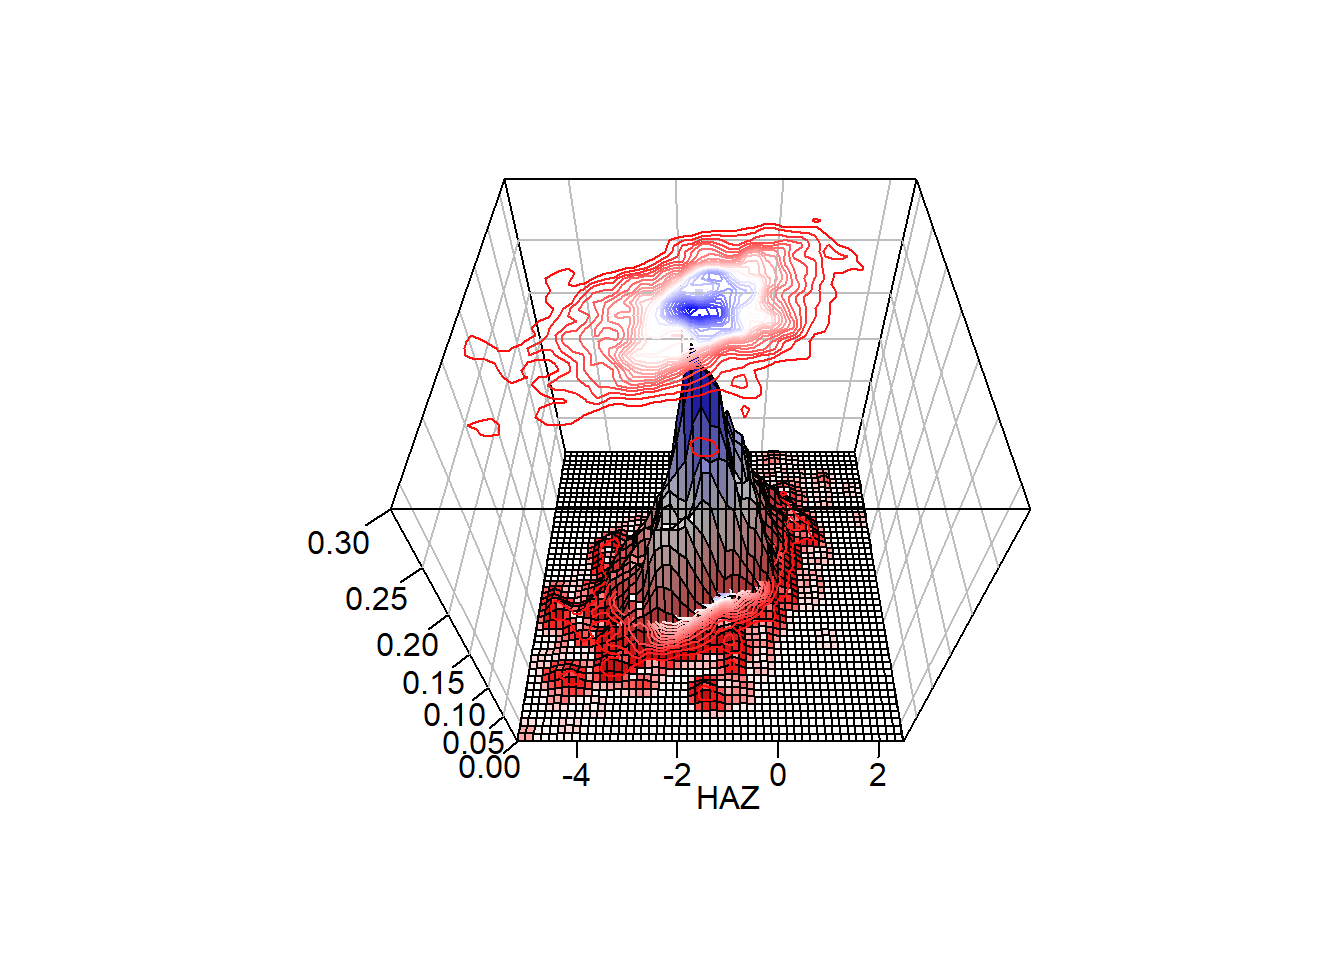
layout(title = "Bivariate HCAZ HAZ Estimate",
scene = list(
eye = list(x = -1.25, y = 1.25, z = 1.25),
bgcolor = "rgb(244, 244, 248)" ,
xaxis = list(title = "haz"),
yaxis = list(title = "hcaz"),
zaxis = list(title = "Density",
range=c(-0.8,1.2) ) ))
plane_data1 <- data.frame(
x = rep(c(-5.186198,2.477165), each = 2),
y = rep(c(-5.186198,2.477165), times = 2),
z = rep(-1, 4)
)
plane_data2 <- data.frame(
x = rep(c(-5.186198,2.477165), each = 2),
y = rep(c(-5.186198,2.477165), times = 2),
z = rep(1.2, 4)
)
x_const <- -2
y_plane <- seq(-5.186198, 2.477165 , length.out = 10)
z_plane <- seq(-0.5, 1.2, length.out = 10)
x_matrix <- matrix(x_const,
nrow = length(y_plane),
ncol = length(z_plane))
y_const <- -3
x_plane <- seq(-5.186198, 2.477165 , length.out = 10)
z_plane <- seq(-0.5, 1.2, length.out = 10)
y_matrix <- matrix(y_const,
nrow = length(x_plane),
ncol = length(z_plane))
p <- p %>%
add_surface(
x = x_matrix,
y = matrix(y_plane, nrow = 10, ncol = 10, byrow = FALSE),
z = matrix(z_plane, nrow = 10, ncol = 10, byrow = TRUE),
opacity = 0.1,
showscale = FALSE,
showscale = FALSE,
inherit = FALSE ,
#colorscale = "Greys",
colors = "blue",
name = paste("Section at HAZ =", x_const)
) %>%
add_surface(
x = matrix(x_plane, nrow = 10, ncol = 10, byrow = FALSE),
y = y_matrix ,
z = matrix(z_plane, nrow = 10, ncol = 10, byrow = TRUE),
opacity = 0.1,
showscale = FALSE,
showscale = FALSE,
inherit = FALSE ,
colors = "blue",
name = paste("Section at HCAZ =",y_const)
)
p